SFDR PAI statement template in Excel: the 14 mandatory indicators, the Annex I formulae, and a workbook that computes them
A financial market participant that considers the principal adverse impacts of its investment decisions publishes a statement each year in a prescribed table. The table's layout is fixed by Annex I to Commission Delegated Regulation (EU) 2022/1288, and so are the formulae behind each indicator. This page sets out what the statement has to contain for investments in investee companies, and shows the Excel workbook Bindler built to compute the 14 mandatory indicators from a holdings register. It is a calculation aid, not the disclosure itself.
When and in what form
Under Article 4(1) of the Delegated Regulation the statement is published by 30 June each year and covers the preceding calendar year, 1 January to 31 December. It follows the template in Table 1 of Annex I: for each indicator, the metric, the impact in year n, the impact in year n-1, an explanation, and the actions taken and planned. Year n is arithmetic; the explanation and actions are narrative the regulation expects you to write.
The 14 mandatory indicators for investee companies
Table 1 groups them by theme:
| Theme | Indicator | Metric |
|---|---|---|
| Greenhouse gas emissions | 1. GHG emissions | Scope 1, Scope 2, Scope 3 and total, in tCO2e |
| 2. Carbon footprint | tCO2e per EUR million invested | |
| 3. GHG intensity of investee companies | tCO2e per EUR million revenue, investment-weighted | |
| 4. Exposure to companies active in the fossil fuel sector | share of investments | |
| 5. Share of non-renewable energy consumption and production | share, investment-weighted | |
| 6. Energy consumption intensity per high impact climate sector | GWh per EUR million revenue | |
| Biodiversity | 7. Activities negatively affecting biodiversity-sensitive areas | share of investments |
| Water | 8. Emissions to water | tonnes per EUR million invested, weighted average |
| Waste | 9. Hazardous waste and radioactive waste ratio | tonnes per EUR million invested, weighted average |
| Social and employee matters | 10. Violations of UNGC principles and OECD Guidelines | share of investments |
| 11. Lack of processes to monitor compliance with UNGC and OECD Guidelines | share of investments | |
| 12. Unadjusted gender pay gap | average, investment-weighted | |
| 13. Board gender diversity | average ratio of female to male board members, investment-weighted | |
| 14. Exposure to controversial weapons | share of investments |
Indicators for sovereigns and supranationals (15 and 16) and real estate assets (17 and 18) sit in the same table but need different data and are outside this workbook.
The three GHG formulae, as Annex I states them
- GHG emissions (1): the sum over investees of (current value of investment divided by the investee's enterprise value) multiplied by the investee's Scope 1, 2 or 3 emissions. The attribution share is the same idea PCAF uses.
- Carbon footprint (2): the same sum for Scope 1, 2 and 3 together, divided by the current value of all investments in EUR million.
- GHG intensity (3): the sum over investees of (current value of investment divided by the current value of all investments) multiplied by (the investee's Scope 1, 2 and 3 emissions divided by its revenue in EUR million).
Enterprise value, per the Annex I definition the workbook carries, is the sum at fiscal year-end of the market capitalisation of ordinary shares, the market capitalisation of preferred shares and the book value of total debt and non-controlling interests, without deducting cash. The share-of-investments indicators (4, 7, 10, 11, 14) are the current value of the flagged holdings divided by the current value of all investments; the weighted averages (5, 8, 9, 12, 13) weight each investee's figure by its share of the portfolio.
The workbook
The SFDR PAI Statement Workbook computes all 14 with live formulas, no macros, no locked cells. Four sheets:
- Guide: the method, the deadline and the scope of the edition.
- PAI Statement: Table 1 in the regulation's layout for investee companies. The Impact [year n] column computes from Holdings; [year n-1], Explanation and Actions are inputs. Header fields for the participant, LEI and reference period.
- Holdings: a register for 100 investees in EUR: current value of investment, enterprise value, Scope 1, 2 and 3, revenue, and the flags and metrics for indicators 4 to 14. A blank cell is left out of the indicator rather than treated as zero, so you can say in the Explanation what coverage you had.
- Definitions and sources: the exact formula used for each indicator, the enterprise value definition and the weighting method, with the EUR-Lex reference.


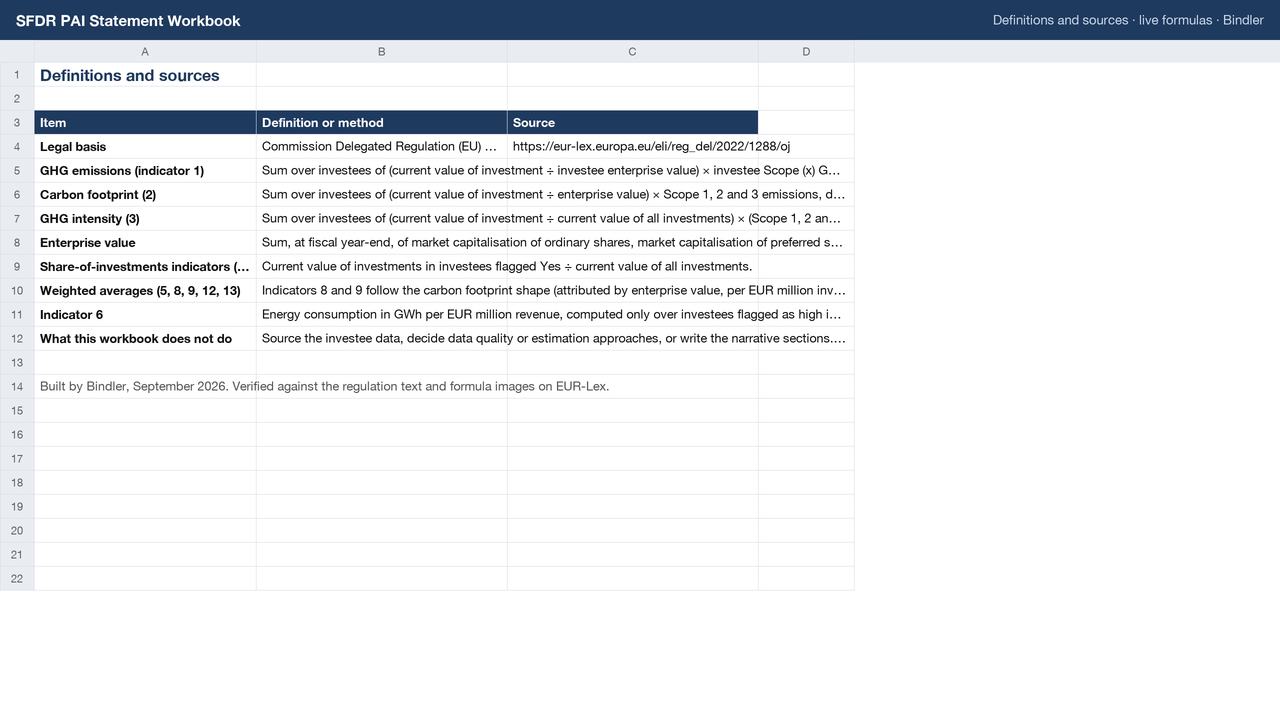
The workbook was recalculated with a formula engine and checked against hand calculation on a test portfolio before listing (Scope 1 6 100, Scope 2 1 650, Scope 3 27 000 tCO2e; carbon footprint 695; GHG intensity 196.5; every share-of-investments indicator matching). Denominators are guarded so blank rows do not produce divide-by-zero errors.
What it does not do
It does not gather investee data: emissions, revenue, enterprise value and the flags come from your data provider or the investee's own reporting. It does not cover the sovereign and real estate indicators or the optional Tables 2 and 3, and it does not write the explanation or the actions.
Sources
- Commission Delegated Regulation (EU) 2022/1288, Article 4(1) (publication by 30 June, calendar-year reference period) and Annex I (Table 1 indicators 1 to 14 and the formulae): eur-lex.europa.eu/eli/reg_del/2022/1288/oj.
- Regulation (EU) 2019/2088 (SFDR), Article 4, on the consideration of principal adverse impacts.
Search terms this page answers: sfdr pai statement template excel, principal adverse impact indicators template, sfdr annex i table 1 excel, pai indicators calculation, sfdr carbon footprint ghg intensity formula.